Quiz
Please answer the following questions using the information you learned from this website. Answer the questions on a separate sheet of paper. You can find the answers to the questions at the bottom of the "Resource" page.
1. What type of graph would be the most appropriate to represent data over a period of time?
(a) circle
(b) line
(c) bar
(d) table
2. What kind of information would a circle graph represent?
1. What type of graph would be the most appropriate to represent data over a period of time?
(a) circle
(b) line
(c) bar
(d) table
2. What kind of information would a circle graph represent?

3. What type of graph would best represent the table to the left?
(a) circle
(b) line
(c) bar
(d) table
(a) circle
(b) line
(c) bar
(d) table
4. Name all of the parts that must be included when making a bar or a line graph.
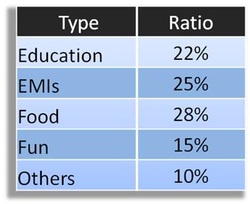
5. What type of graph would best represent the table to the left?
(a) circle
(b) line
(c) bar
(d) table
(a) circle
(b) line
(c) bar
(d) table
