These are the parts of a graph that you will need to incorporate into your graphs:
- Title - appears at the top of the graph and should describe the data within the graph
- x-axis label - the name given to represent the information graphed on the x-axis (the horizontal axis)
- y-axis label - the name given to represent the information graphed on the y-axis (the vertical axis)
- Key/Legend - if more than one set of data is being graphed within one graph, a key or legend is useful. It would be necessary for a double bar graph or a double line graph, as well as a circle graph. The key or legend tells what the pieces of the graph represent, sometimes by color coding. It helps the reader understand what they are looking at.
- The Data - the information shown in the graph
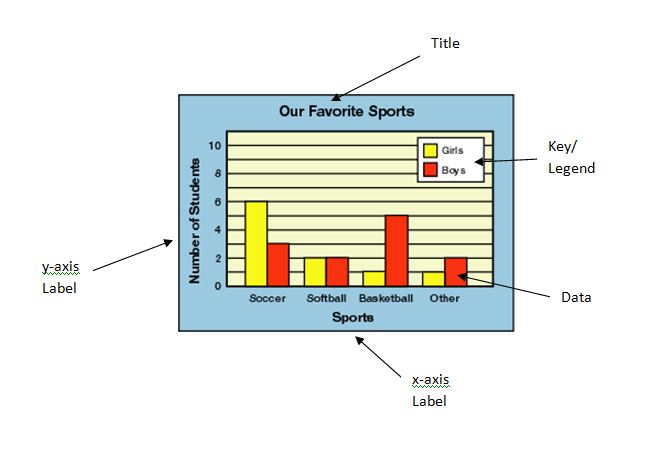
The following is an example of the parts of a graph needed for creating bar graphs:
The following is an example of the parts of a graph needed for creating line graphs:

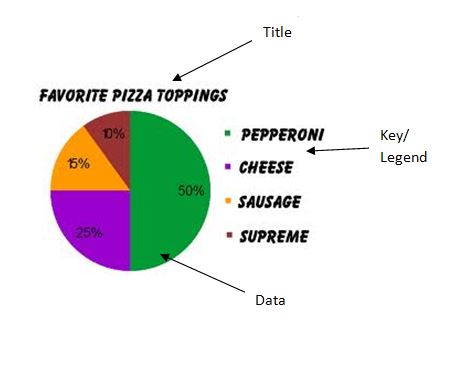
The following is an example of the parts of a graph needed for creating circle graphs:
(notice that a circle graph does not contain an x-axis or a y-axis, so labels are not needed)
(notice that a circle graph does not contain an x-axis or a y-axis, so labels are not needed)